
Shipwrecks by State: America’s Most Haunted Waters for 2026
Every coastline has its stories… A ship that never made it home. A hull nobody ever found. Spots where boats give a wide berth for reasons nobody quite remembers! Most people dismiss those stories as local legend. However, this Halloween, the numbers say otherwise.
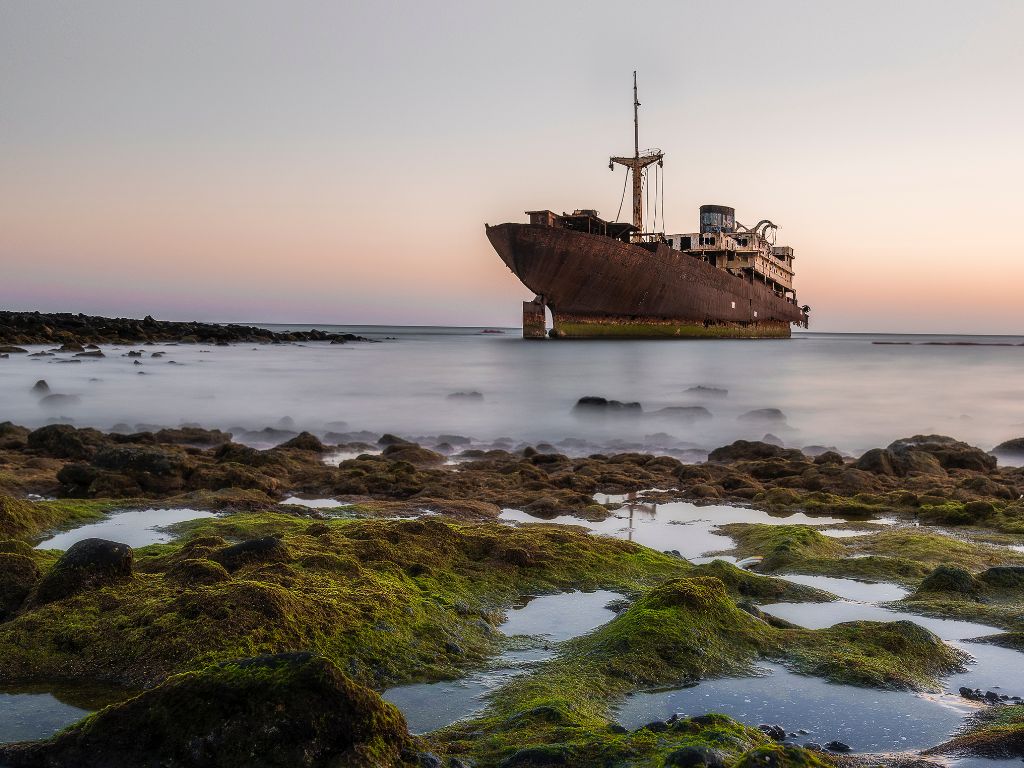
Using NOAA’s own nautical chart data (the same charts vessels use for real-world navigation), this ranking counts every shipwreck charted along the entire US coastline.
Florida wins by a mile, as expected. What we didn’t expect, though, was for New York and Louisiana to be locked in a near-tie for second place – separated by just 32 wrecks out of thousands! And Mississippi – a state that doesn’t even crack the top 10 by raw count – has the single most hazardous fleet of shipwrecks in the entire country.
Key Findings
- Across 23 coastal states, NOAA’s counts 13,067 shipwrecks. Remarkably, 2,313 of them still show a mast or hull breaking the surface today.
- Florida is the undisputed shipwreck capital of the country, with 2,302 charted wrecks – more than the next two states combined. One in five of them, in fact, sits in a single county: Monroe, home to the Florida Keys.
- New York and Louisiana, meanwhile, are in a near-tie for second place: 1,510 vs. 1,478 – a gap of just 32 wrecks nationwide.
- Mississippi has the smallest fleet on the list but the sharpest edge because 83% of its charted wrecks are still flagged as navigation hazards, the highest share of any state.
- Long Island’s waters have carried the nickname “Wreck Valley” for decades among divers. And NOAA’s data backs it up, with Suffolk County alone charting 347 wrecks.
The most hazardous fleet in America isn’t in Florida, though. White Mississippi’s charted wrecks number just 225 (barely a tenth of Florida’s total), 83% of them are still marked a hazard to navigation today! No other state comes close.
What actually makes a wreck “charted”?
NOAA’s nautical charts exist to keep ships from hitting things. When a vessel goes down, NOAA logs it as a WRECKS feature, the same layer that shows reefs, rocks, and other hazards. Each entry, therefore, carries a few pieces of detail:
- How deep it sits
- Whether it still shows above the waterline
- Whether the Coast Survey still classifies it as a hazard to navigation. This means ships need to steer around it, not that the surrounding water is unsafe to swim, fish, or boat in!
Specifically we split every wreck into four groups:
| Status | What It Means |
|---|---|
| Hazard | A current risk to passing vessels. |
| Cleared | No longer considered a hazard (often deep enough now to pass over safely). |
| Visible | A mast or hull still breaks the surface. |
| Scattered | Debris rather than an intact wreck. |
A wreck can belong to more than one group, since a visible wreck showing its mast is very often also still a hazard…
The Top 10: Most Charted Wrecks
| Rank | State | Charted Wrecks | Still a Hazard |
|---|---|---|---|
| 1 | Florida | 2,302 | 65% |
| 2 | New York | 1,510 | 72% |
| 3 | Louisiana | 1,478 | 68% |
| 4 | Virginia | 856 | 74% |
| 5 | Texas | 823 | 68% |
| 6 | Maryland | 788 | 80% |
| 7 | Massachusetts | 741 | 47% |
| 8 | California | 738 | 48% |
| 9 | North Carolina | 668 | 66% |
| 10 | Alaska | 622 | 39% |
The Twist: Where the Highest Share Is Still a Hazard
Raw counts, of course, favor states with more coastline and more traffic. A different question though – what share of a state’s own charted wrecks NOAA still marks hazardous – tells a different story entirely. And it isn’t Florida’s.
| Rank | State | Still a Hazard | Charted Wrecks |
|---|---|---|---|
| 1 | Mississippi | 83% | 225 |
| 2 | Maryland | 80% | 788 |
| 3 | Alabama | 75% | 118 |
| 3 | Delaware | 75% | 109 |
| 5 | Virginia | 74% | 856 |
| 6 | South Carolina | 73% | 194 |
| 7 | New Jersey | 72% | 550 |
| 7 | New York | 72% | 1,510 |
| 9 | Texas | 68% | 823 |
| 9 | Louisiana | 68% | 1,478 |
(Taken from states with at least 75 classified wrecks, so the percentage reflects a real pattern rather than a handful of records.)
Shipwrecks by State: Highlights
Explore the interactive map to see how your own state stacks up, county by county.
Most charted wrecks
Highest hazard rate
The share of each state’s charted wrecks that NOAA still flags as a hazard to passing boats today, not a safety rating of the water itself.
Source: NOAA Office of Coast Survey nautical chart data, analyzed by BoatBooker. Full methodology below.
The Top 5
Florida – America’s Shipwreck Capital. With 2,302 charted wrecks, Florida is way out ahead. Monroe County, covering the Florida Keys, accounts for 465 of them on its own – nearly a fifth of the entire state’s total! Independent estimates put the total here at over 1,000 wrecks in total once you count undiscovered ones.
New York – Living Up to “Wreck Valley.” Long Island’s waters have carried this nickname among divers for decades, and the charts in fact agree. Suffolk County alone holds 347 wrecks, more than most whole states on this list.
Louisiana – The Bayous Claim Their Share. Terrebonne Parish leads the state with 220 wrecks, a legacy of a century of oil and shipping, and hurricane traffic through its maze of bayous and barrier islands southwest of New Orleans.
Virginia – The Chesapeake’s Toll. Northumberland County, on the state’s rural Northern Neck, holds 113 of Virginia’s 856 wrecks. This is proof that the Chesapeake Bay’s long shipping history reaches well beyond Norfolk’s busy harbor.
Texas – Galveston’s Ghost Fleet. Galveston County, gateway to the Houston Ship Channel, accounts for 132 of the state’s 823 charted wrecks.
Rounding Out the Top 10
Maryland – The Nation’s Highest Major Hazard Rate. NOAA still classes 80% of Maryland’s 788 wrecks as hazards. Anne Arundel County, right at Annapolis’s doorstep, holds 162 of them alone.
Massachusetts – Cape Cod’s Quiet Toll. Barnstable County, covering all of Cape Cod, holds 162 of the state’s 741 wrecks – more than any other Massachusetts county.
California – Los Angeles Leads the Coast. Los Angeles County tops the state with 100 wrecks, part of one of the busiest stretches of port traffic on the Pacific coast.
North Carolina – The Outer Banks Live Up to Their Name. Carteret County, home to Cape Lookout, edges out the rest of the state with 99 wrecks. Dare County, home to Cape Hatteras and the waters that earned the Outer Banks their “Graveyard of the Atlantic” nickname, comes close behind with 82.
Alaska – A Different Kind of Wreck. Kenai Peninsula Borough holds 65 of Alaska’s 622 wrecks. Statewide, NOAA still flags only 39% as hazard, the lowest major-state rate in the country.
Outside the Top Ten
New Jersey – The Shore’s Hidden Fleet. Ocean County holds 95 of the state’s 550 wrecks, tucked beneath the waters of the Jersey Shore’s barrier islands.
Washington – Puget Sound’s Legacy. King County, home to Seattle, tops the state with 92 wrecks.
Mississippi – Small State, Sharpest Edge. With just 225 charted wrecks, Mississippi is the smallest fleet in the national top tier. Still, 83% of them are still active hazards, the highest rate anywhere in the country. Harrison County, covering Gulfport and Biloxi, holds exactly half the state’s total.
The Rest of the Coast. Connecticut, Maine, Rhode Island, South Carolina, Georgia, Alabama, Delaware, Hawaii, Oregon, and New Hampshire round out the ranking – from Charleston County, South Carolina (83 wrecks), to Cumberland County, Maine (47).
The Complete Ranking
| State | Charted Wrecks | Still a Hazard | Top County |
|---|---|---|---|
| Florida | 2,302 | 65% | Monroe County (465) |
| New York | 1,510 | 72% | Suffolk County (347) |
| Louisiana | 1,478 | 68% | Terrebonne Parish (220) |
| Virginia | 856 | 74% | Northumberland County (113) |
| Texas | 823 | 68% | Galveston County (132) |
| Maryland | 788 | 80% | Anne Arundel County (162) |
| Massachusetts | 741 | 47% | Barnstable County (162) |
| California | 738 | 48% | Los Angeles County (100) |
| North Carolina | 668 | 66% | Carteret County (99) |
| Alaska | 622 | 39% | Kenai Peninsula Borough (65) |
| New Jersey | 550 | 72% | Ocean County (95) |
| Washington | 346 | 62% | King County (92) |
| Connecticut | 240 | 58% | Western Connecticut Planning Region (118) |
| Mississippi | 225 | 83% | Harrison County (114) |
| Maine | 216 | 32% | Cumberland County (47) |
| Rhode Island | 200 | 39% | Washington County (87) |
| South Carolina | 194 | 73% | Charleston County (83) |
| Georgia | 146 | 66% | Chatham County (36) |
| Alabama | 118 | 75% | Mobile County (66) |
| Delaware | 109 | 75% | Sussex County (52) |
| Hawaii | 98 | 44% | Maui County (37) |
| Oregon | 76 | 53% | Lincoln County (16) |
| New Hampshire | 8 | – | Rockingham County (7) |
Michigan, Wisconsin, Minnesota, Ohio, Illinois, Indiana, and Pennsylvania sit on the Great Lakes rather than the ocean or Gulf coast and are not included in this ranking.
Methodology
To compile this ranking, BoatBooker analyzed the NOAA Office of Coast Survey nautical chart data to count every shipwreck charted along the US coastline.
Data collection: We downloaded ENC charts for all 23 ocean, Gulf, and Pacific coastal states, including Alaska and Hawaii, and then extracted the WRECKS feature layer from each one.
Cleaning: We removed wrecks charted more than once, and also excluded records that fell outside each state’s actual coastal waters.
Processing: We first checked for wrecks double-counted across state lines, then matched every wreck to its true nearest US county, parish, borough, or city by real geographic distance to that area’s official boundary. We recorded wrecks more than roughly 10 miles from any county by state only.
Classification: A wreck only counts as a “hazard” when NOAA’s own chart data marks it as dangerous for navigation.
These findings reflect BoatBooker’s analysis of NOAA data and do not represent official NOAA conclusions. NOAA notes, too, that its WRECKS database is not fully comprehensive and that some positions are approximate, and that some positions are approximate.
The concept and outline of this article were created by people engaged by BoatBooker. Artificial Intelligence tools were used to flesh out and reformat information into a blog article. Before being published, this article was edited and fact-checked by BoatBooker staff.